BPM Engine Monitoring
|
This feature is available exclusively in the Flowset Control Enterprise edition. |
Flowset Control allows you to view the current state of business processes running inside the engine. However, it is also useful for a system administrator to have information about the overall system health — such as the number of CPU cores, available RAM, disk space, and so on. This information enables administrators to receive early warnings about increasing load. Combined with automatic or manual system scaling, Flowset Control provides a complete solution for managing business process engines.
Monitoring Configuration
In the Enterprise edition, the BPM engine details view is extended with a dedicated Monitoring section:
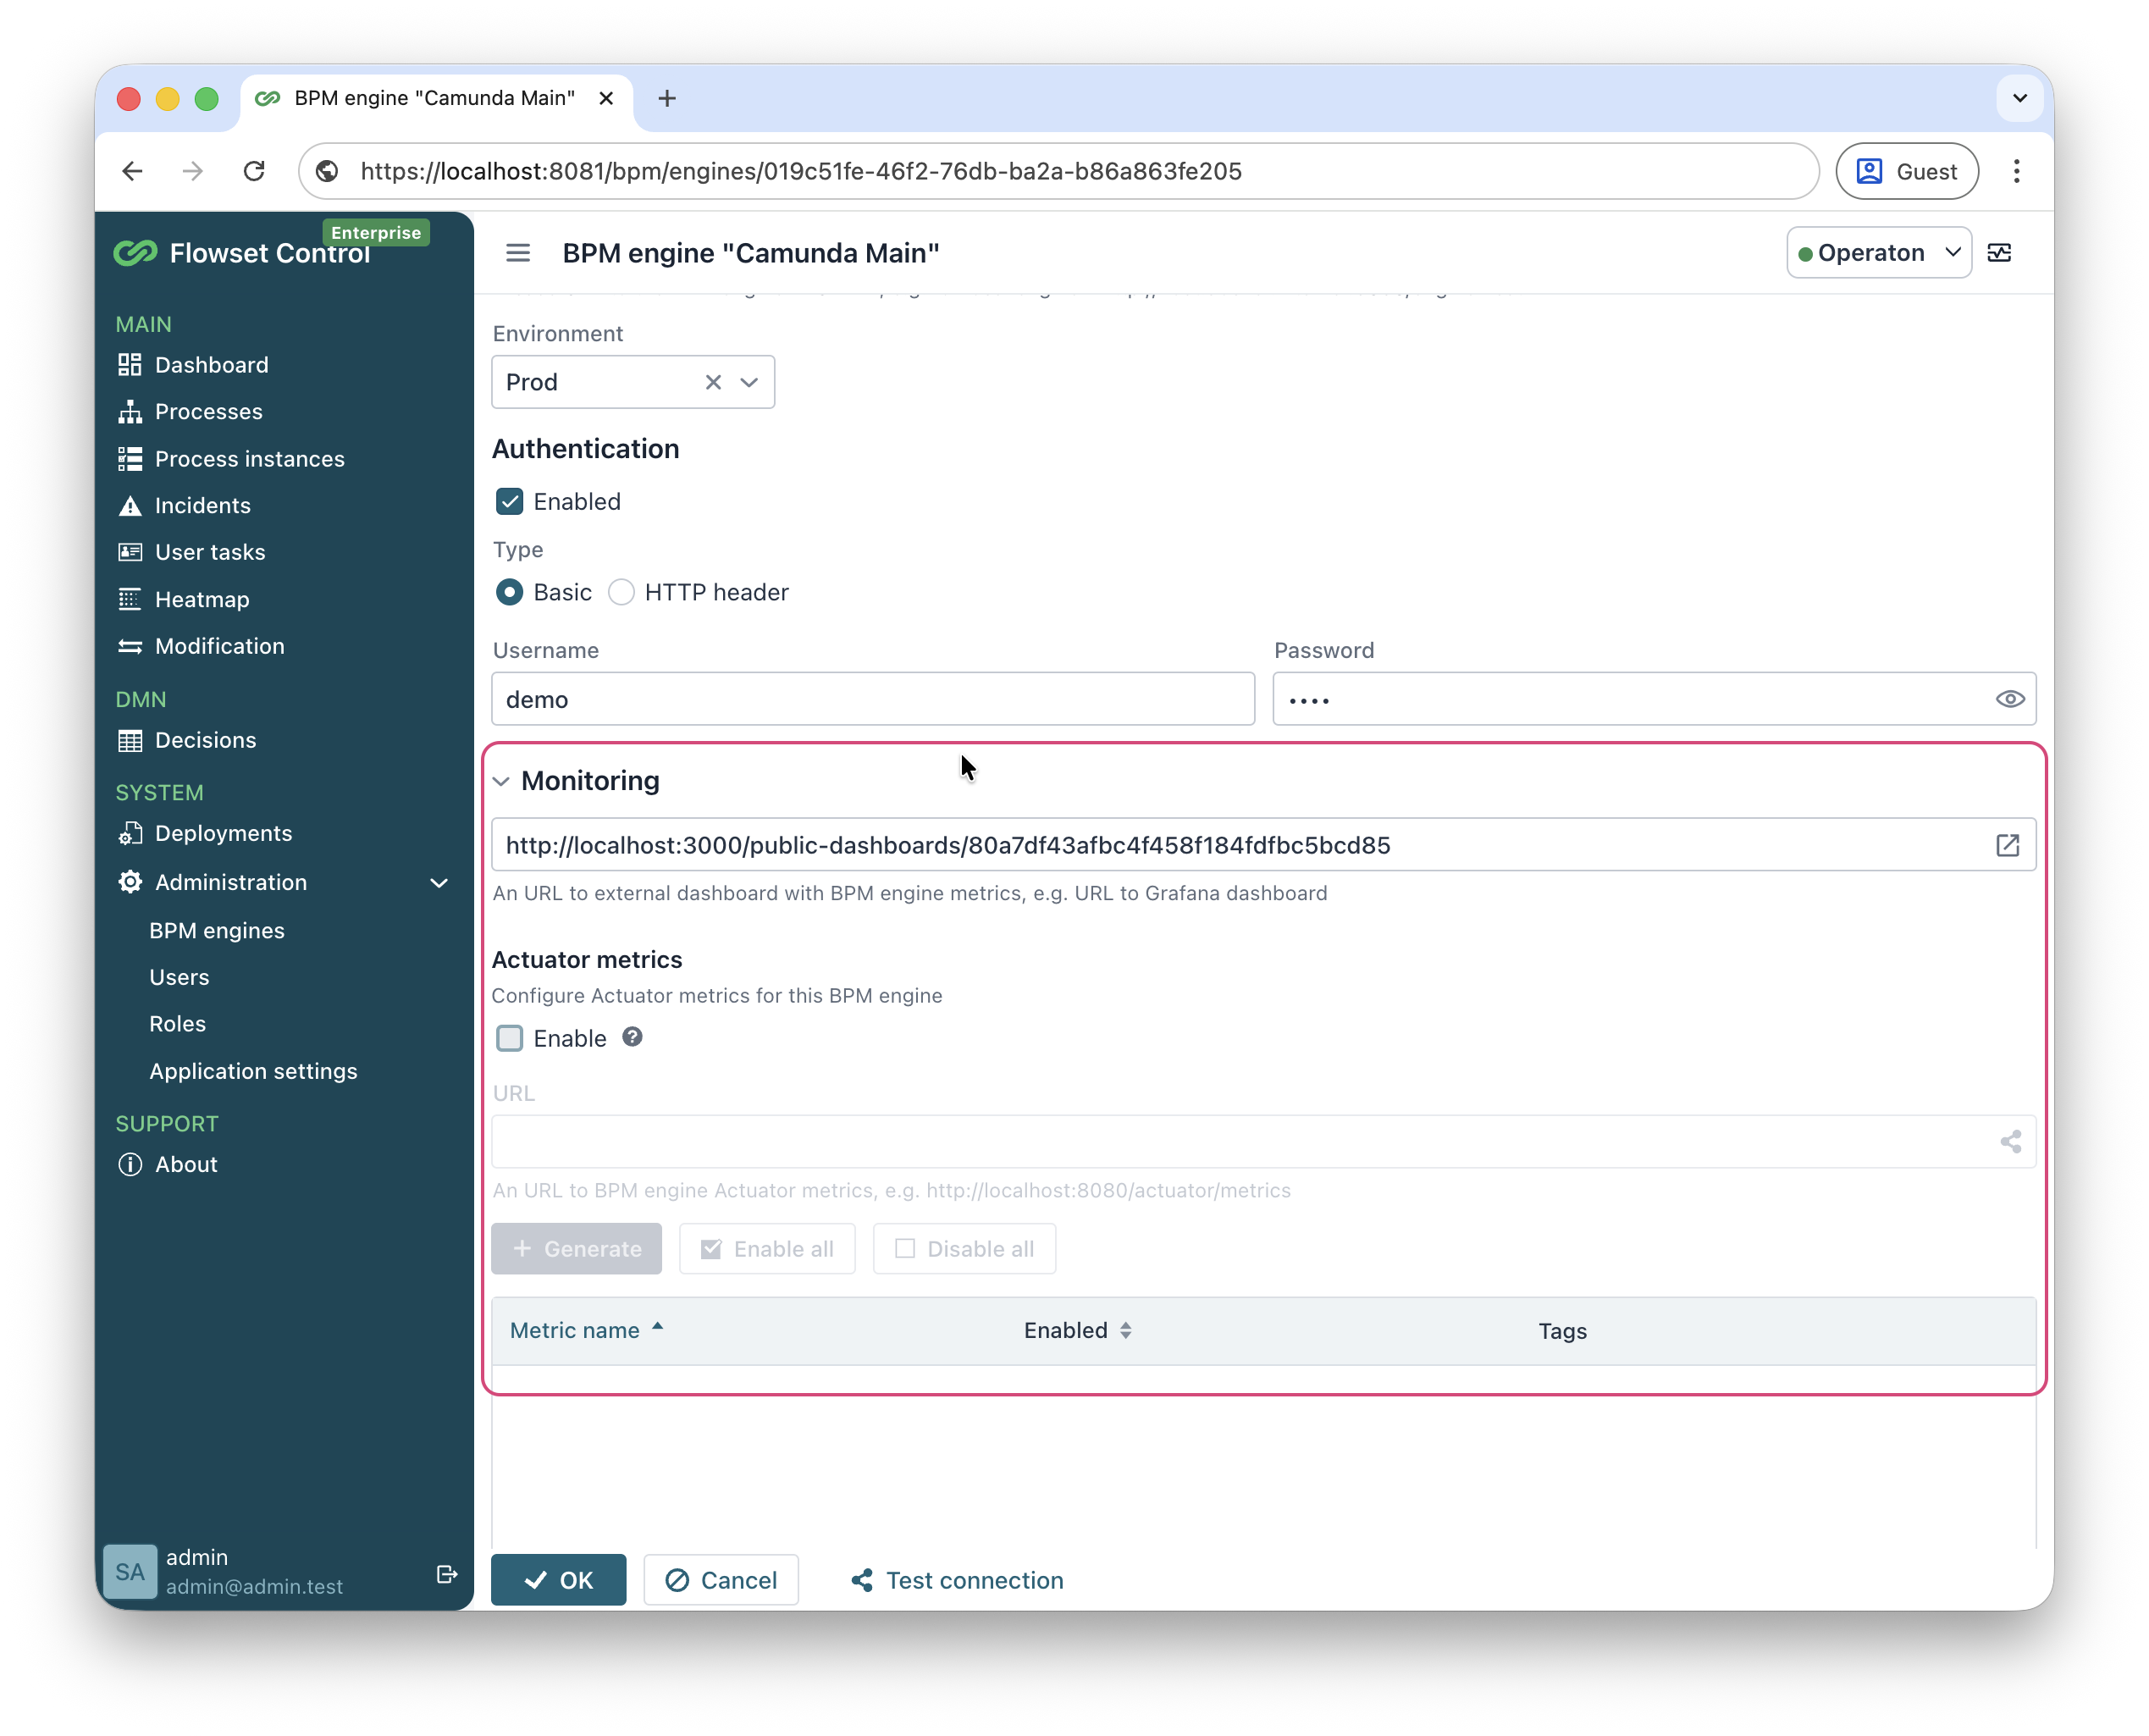
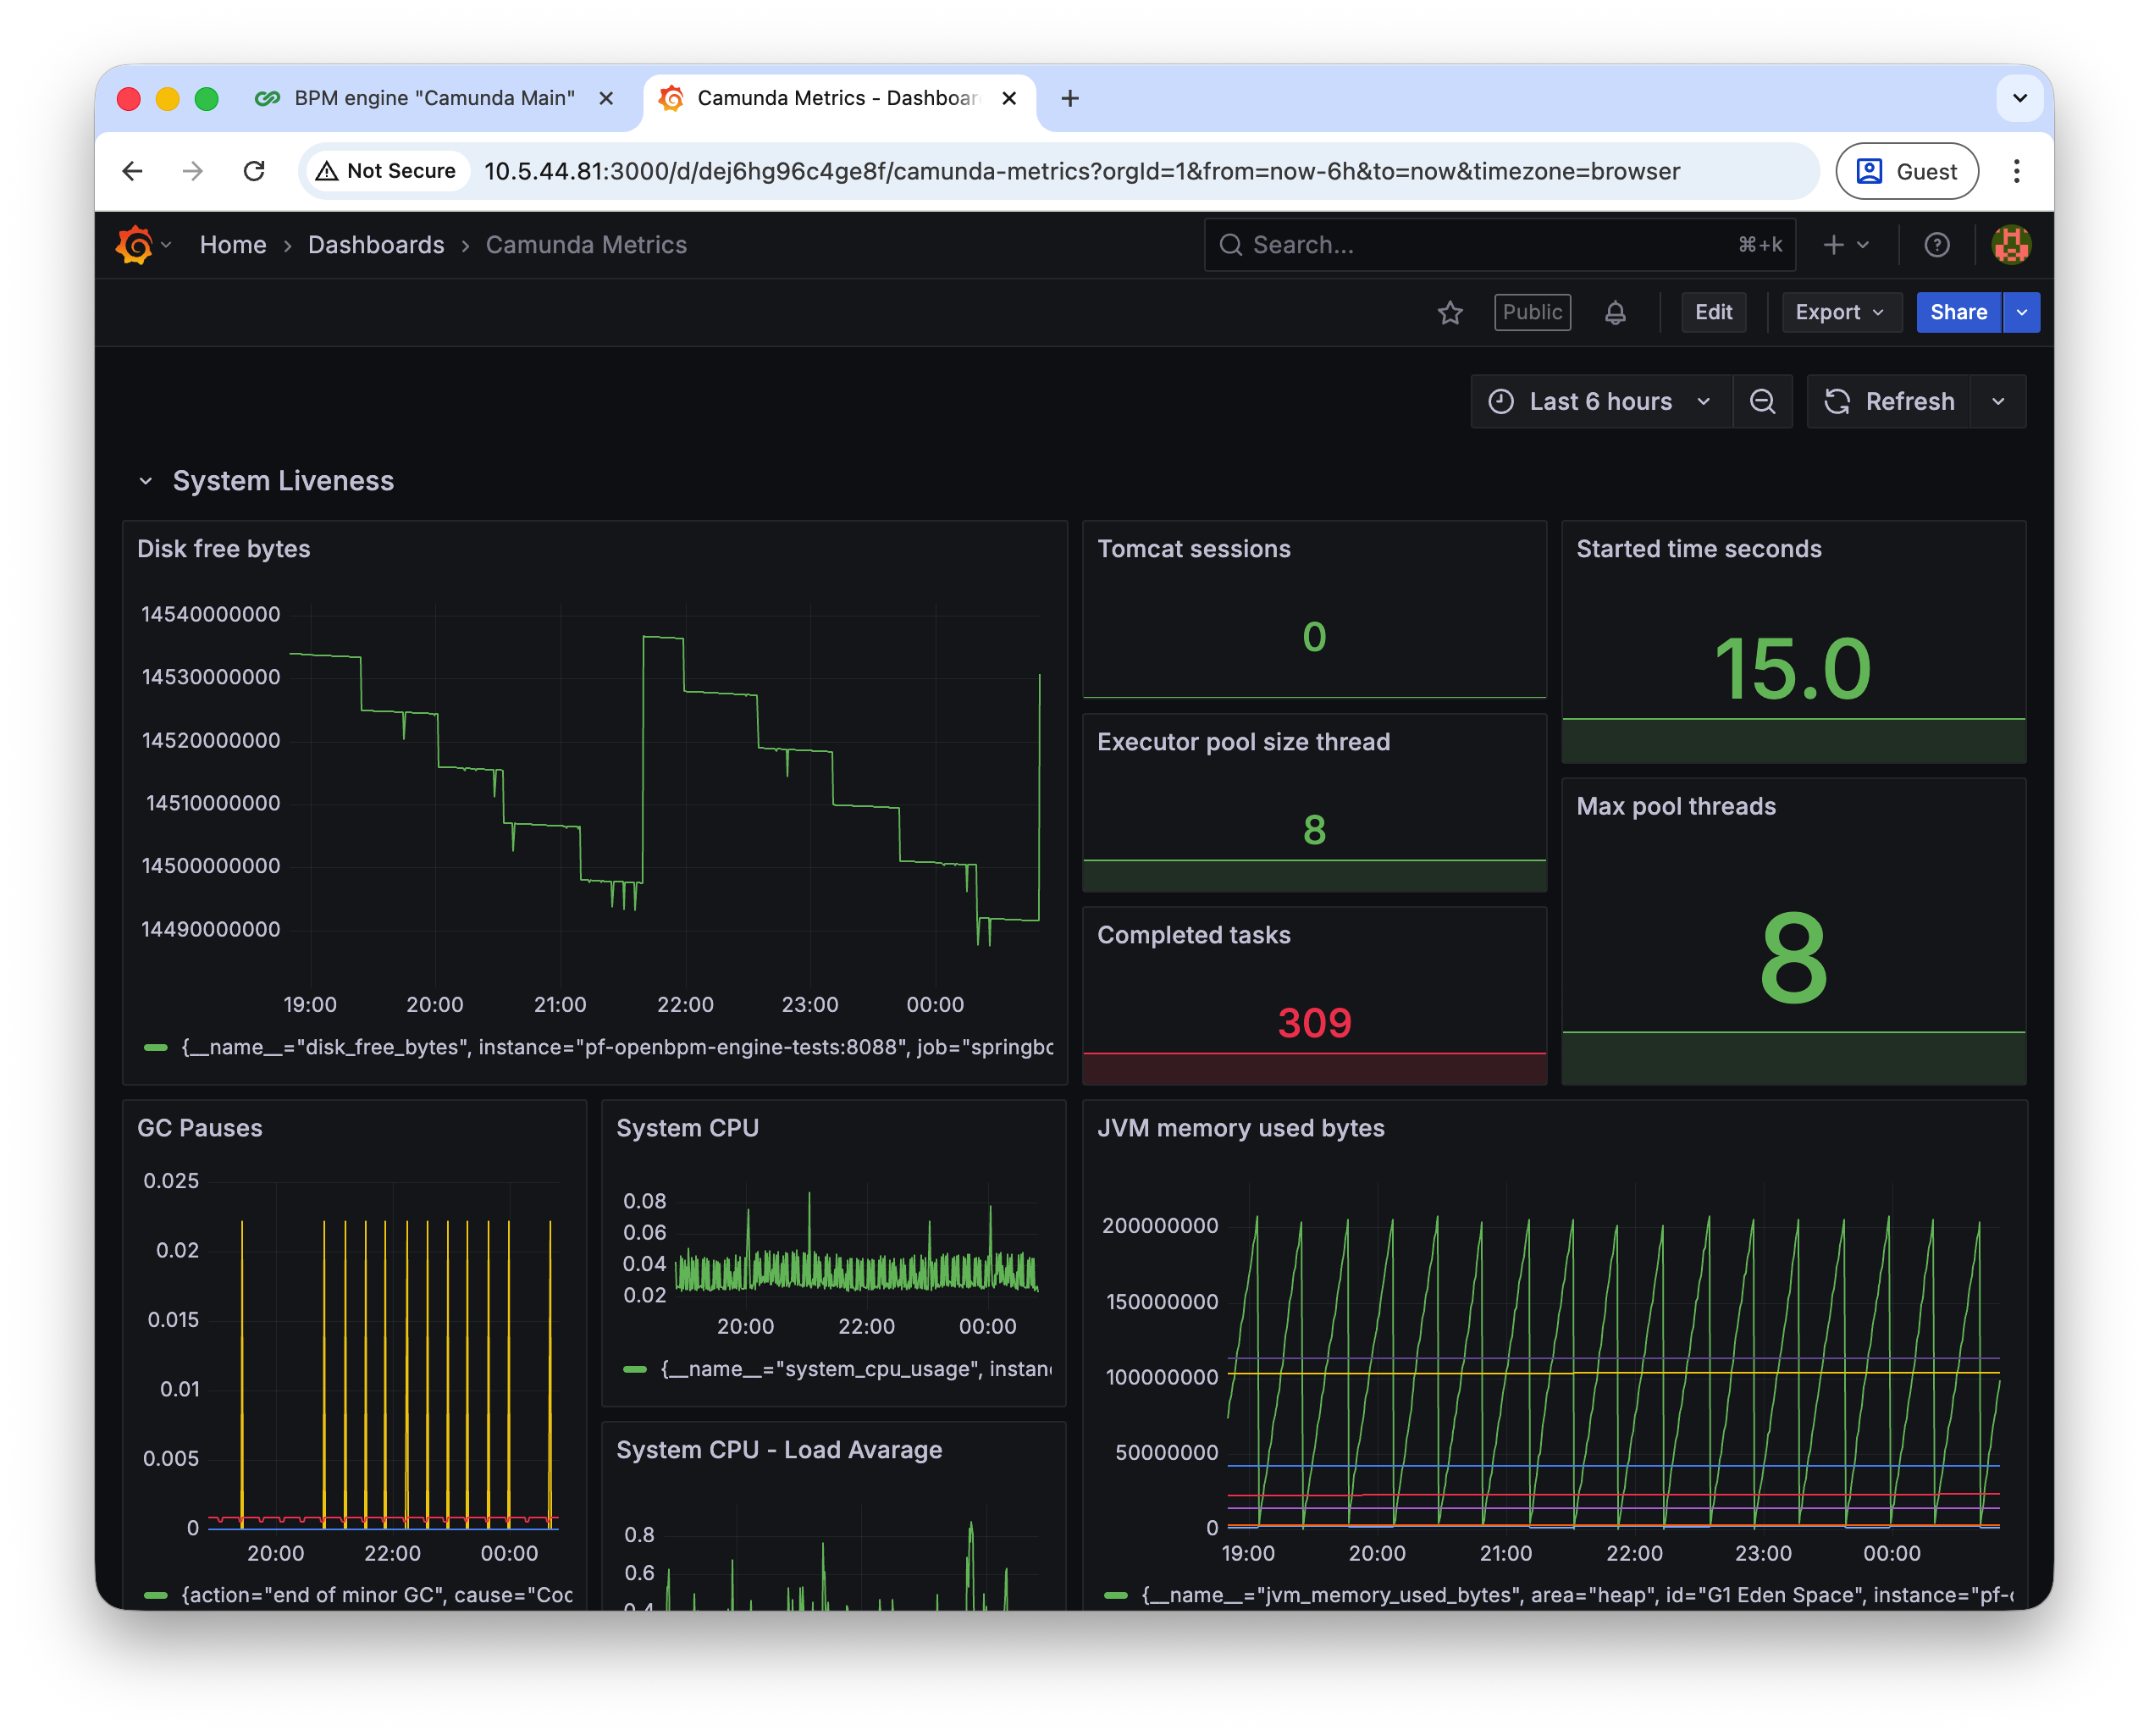
External Dashboard (URL)
-
Specify the URL of an external monitoring dashboard (e.g., Grafana).
-
Example: for Camunda, you can configure a Grafana dashboard and paste its URL here.
-
Provides one-click navigation from Flowset Control directly to the external dashboard:
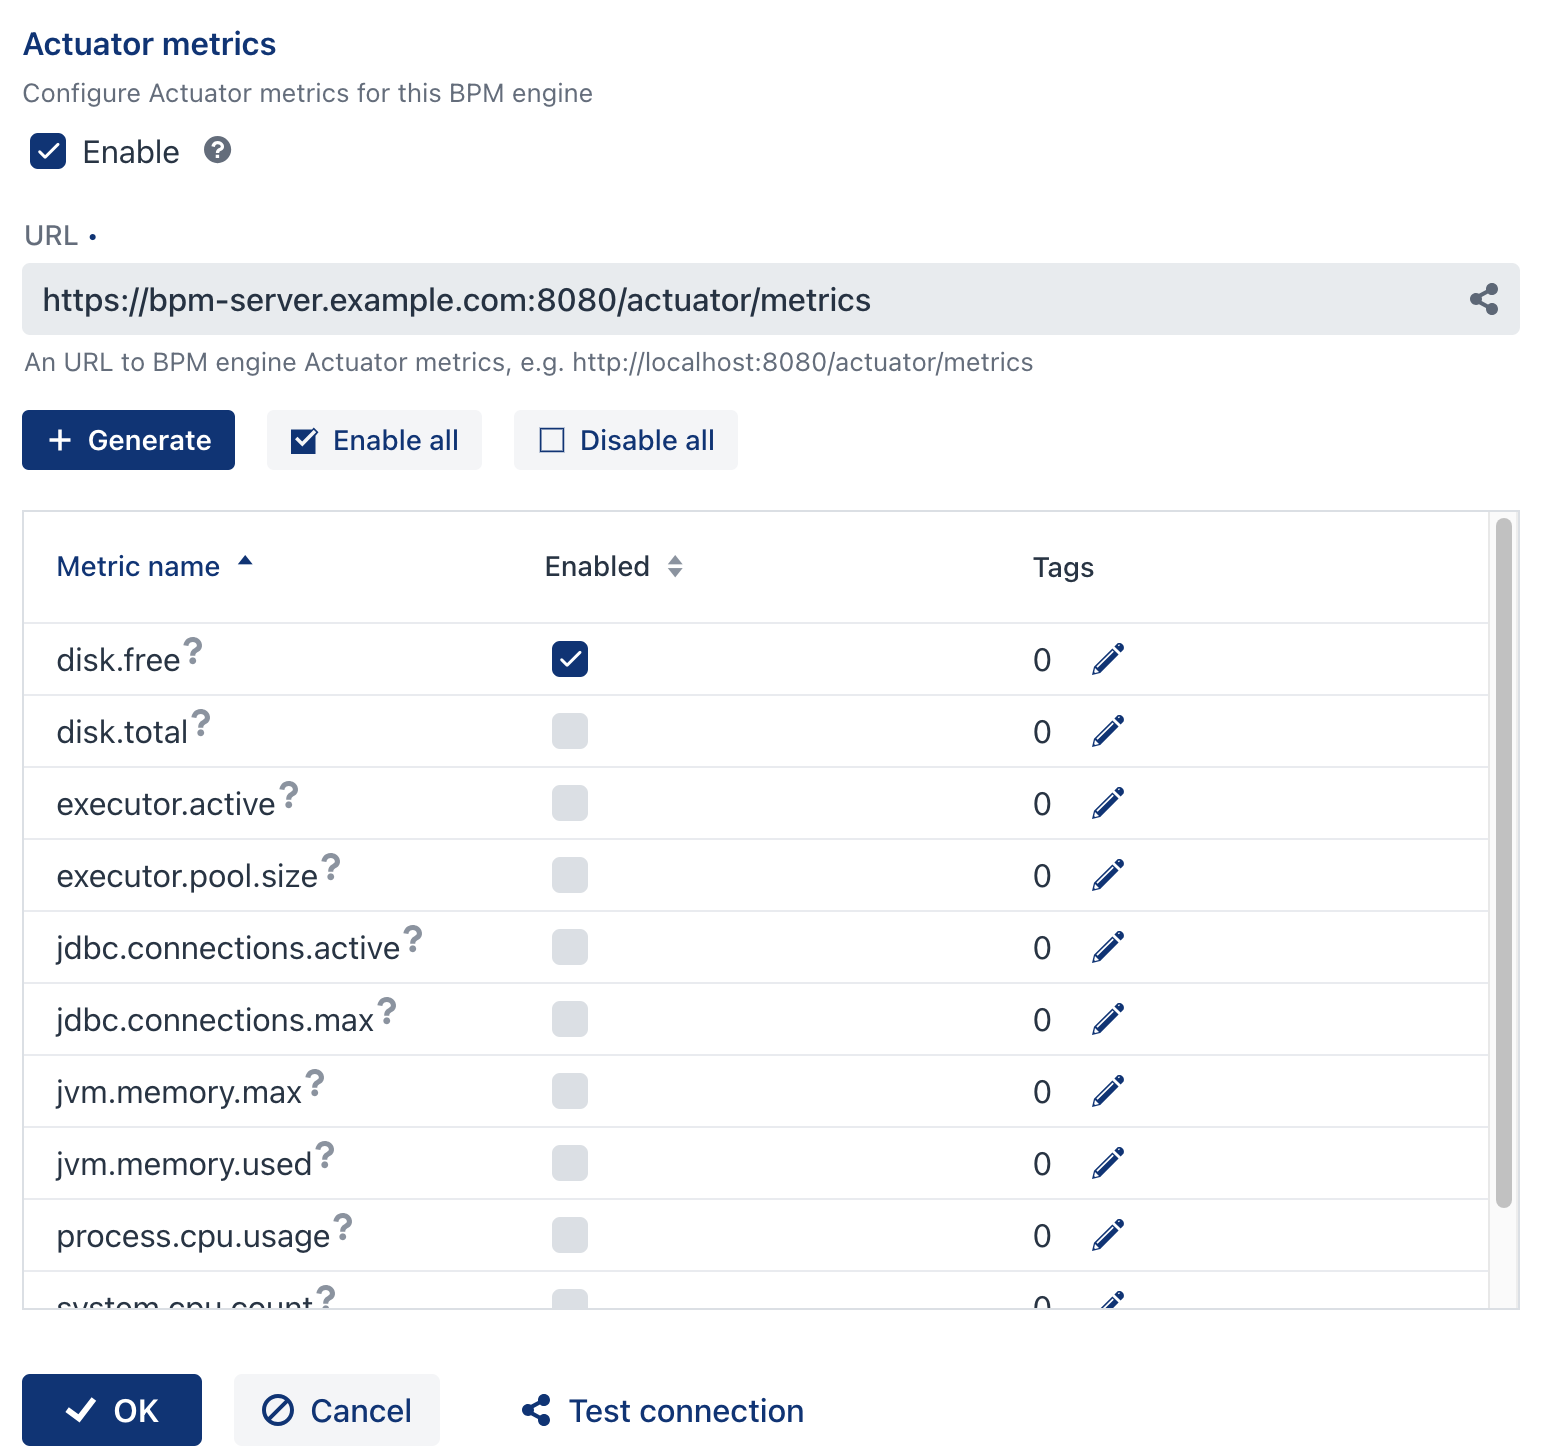
Integrated Metrics
-
Check the Enable checkbox to activate metric collection and display in Flowset Control.
-
URL field: specify the endpoint from which metrics will be fetched (e.g., a Spring Boot Actuator endpoint).
-
Click Generate to load the available metrics from the specified endpoint.
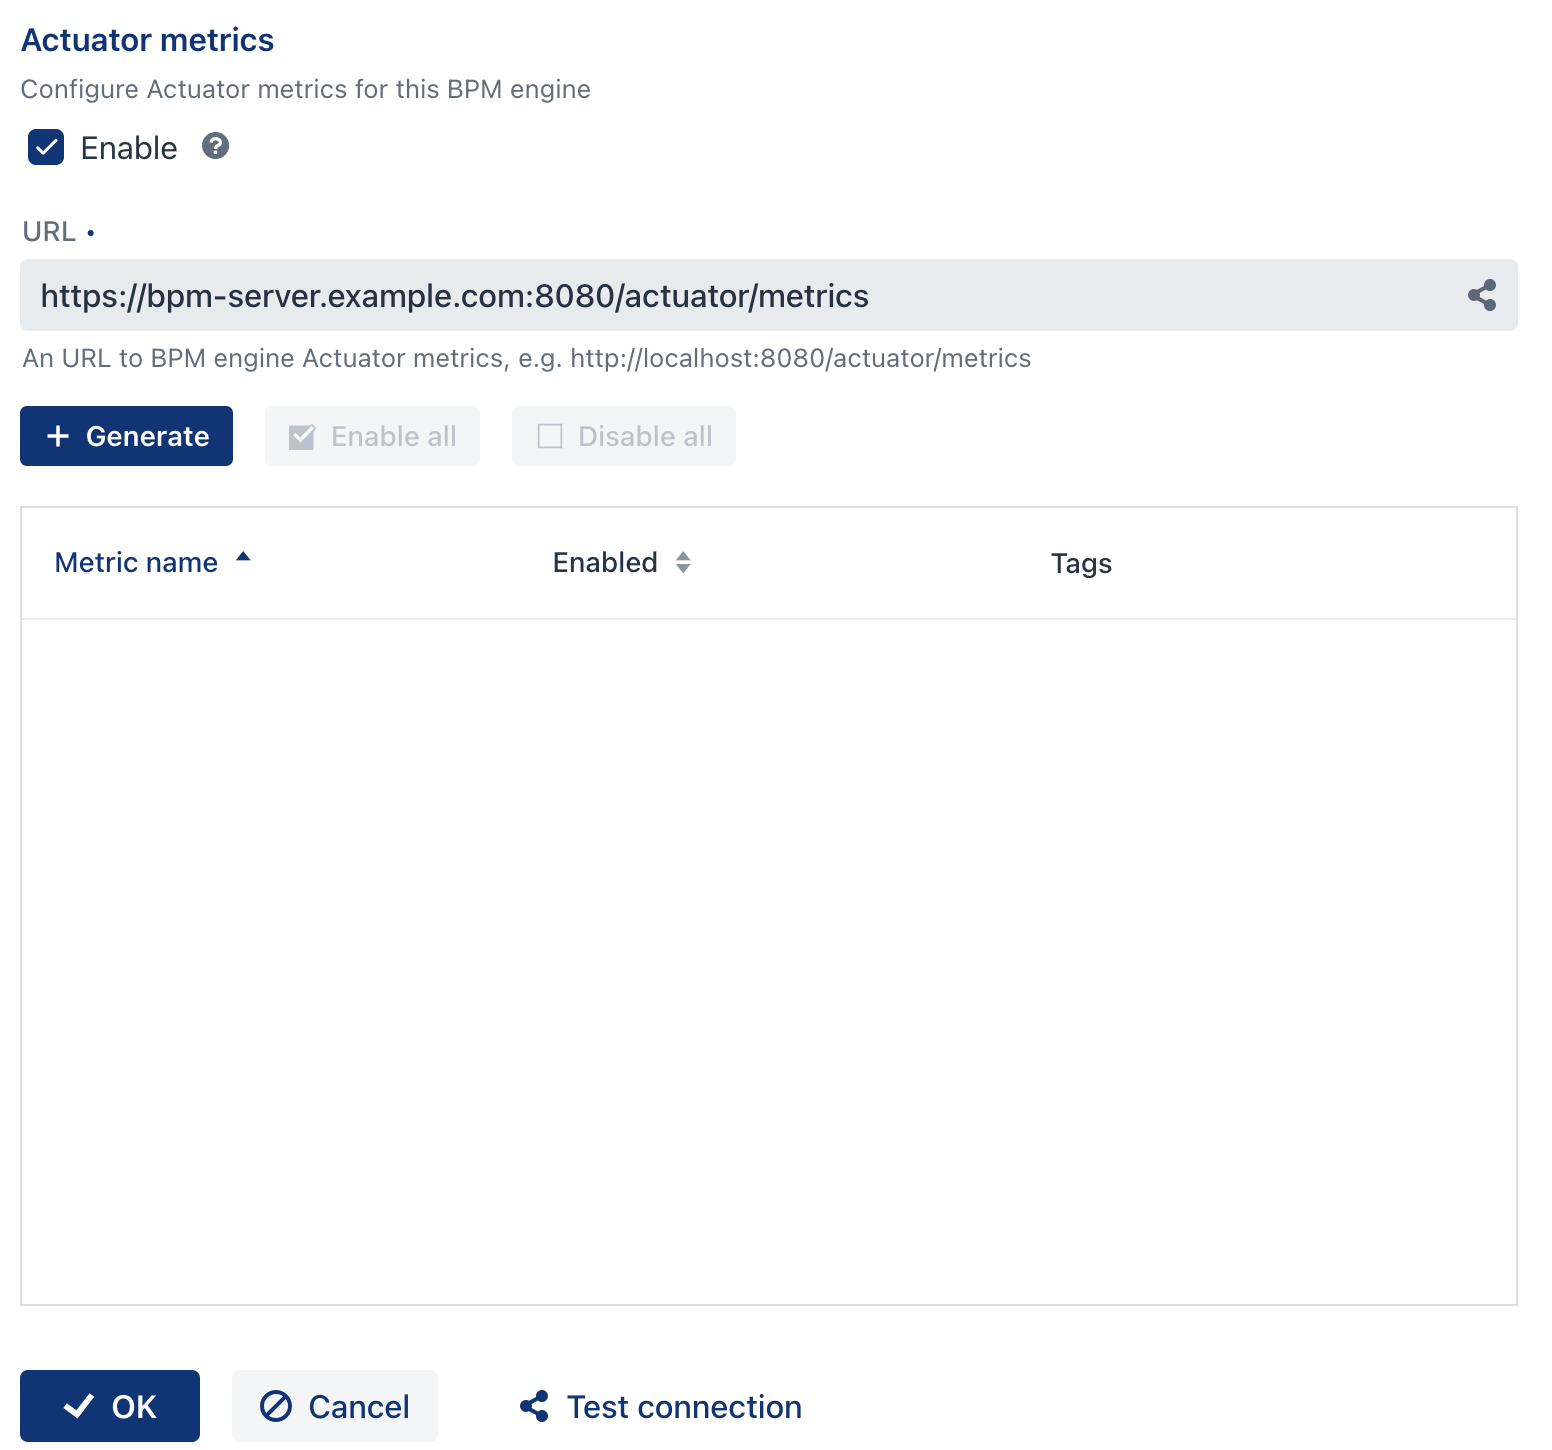
Selecting Metrics
-
Select the desired metrics by checking the boxes next to their names.
-
Hover over the question mark (?) icon to see a brief description of each metric.
-
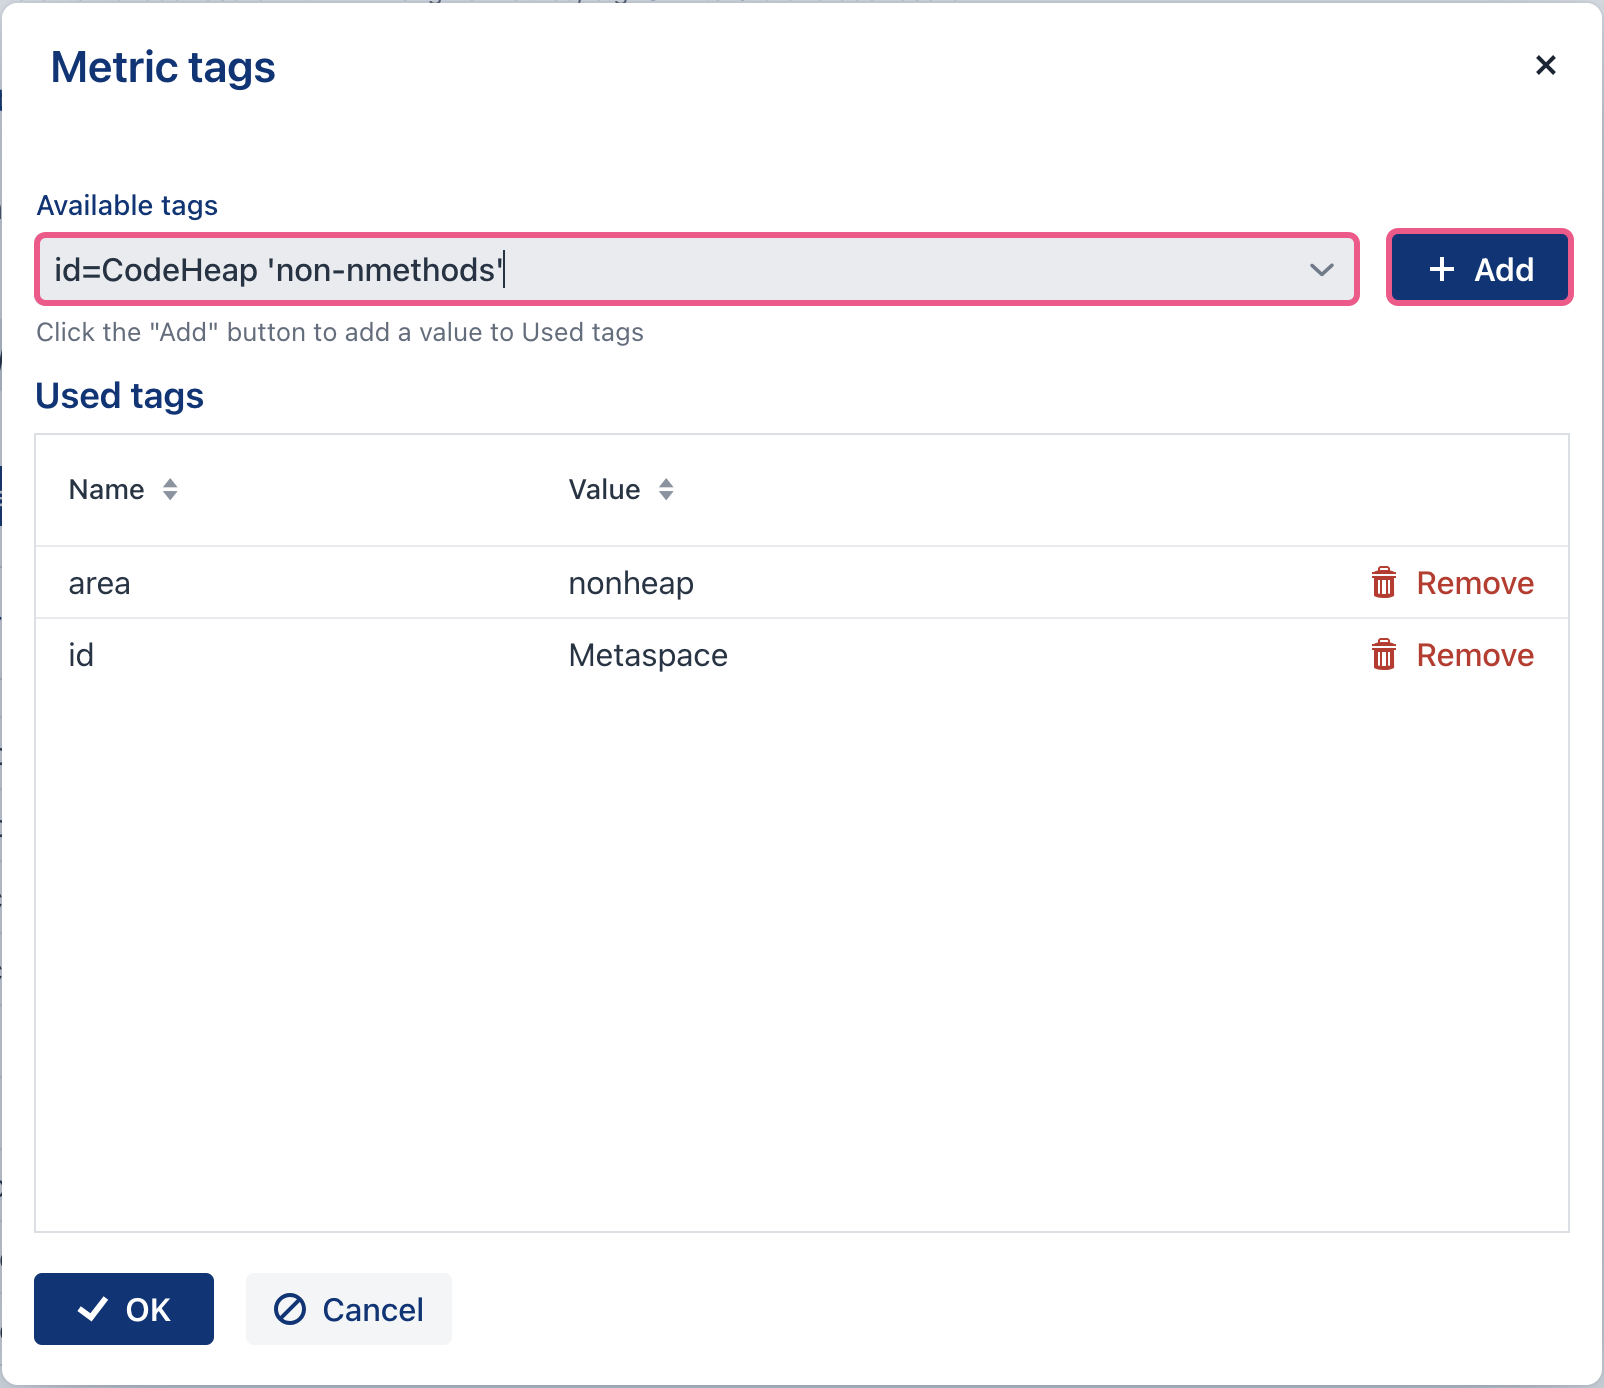
You can configure tags for each metric to enable more granular monitoring of specific areas:
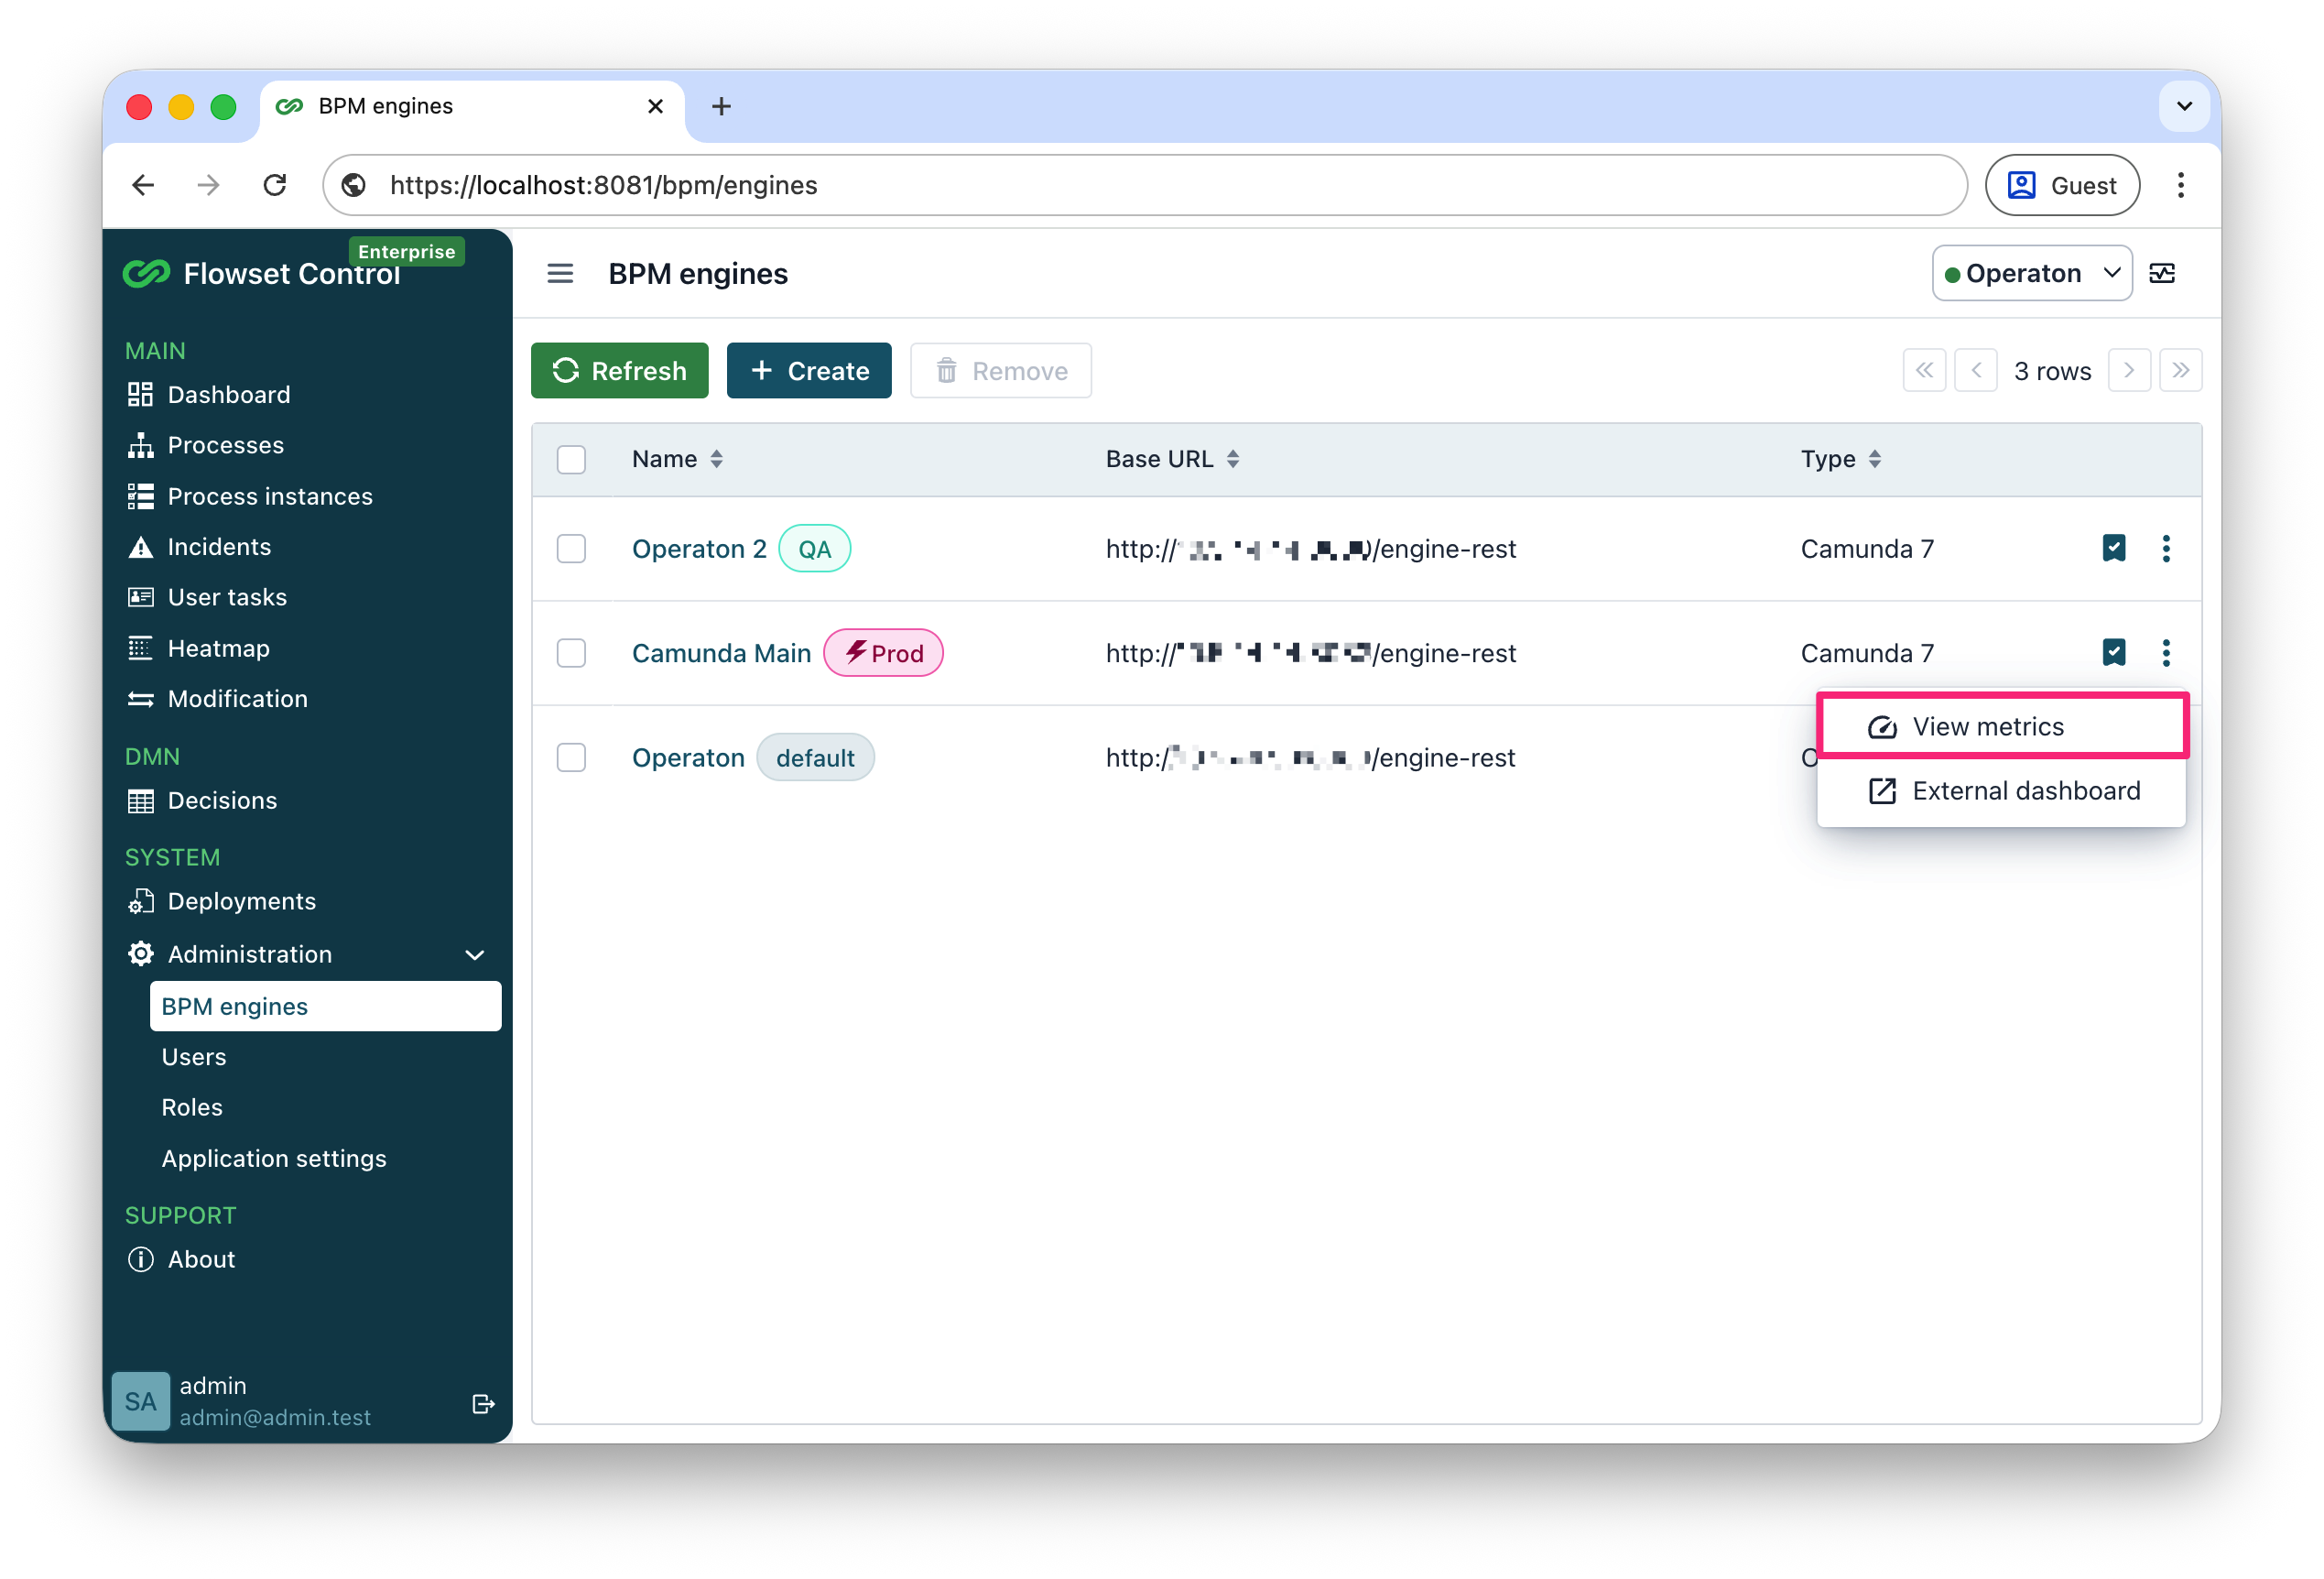
Viewing Metrics
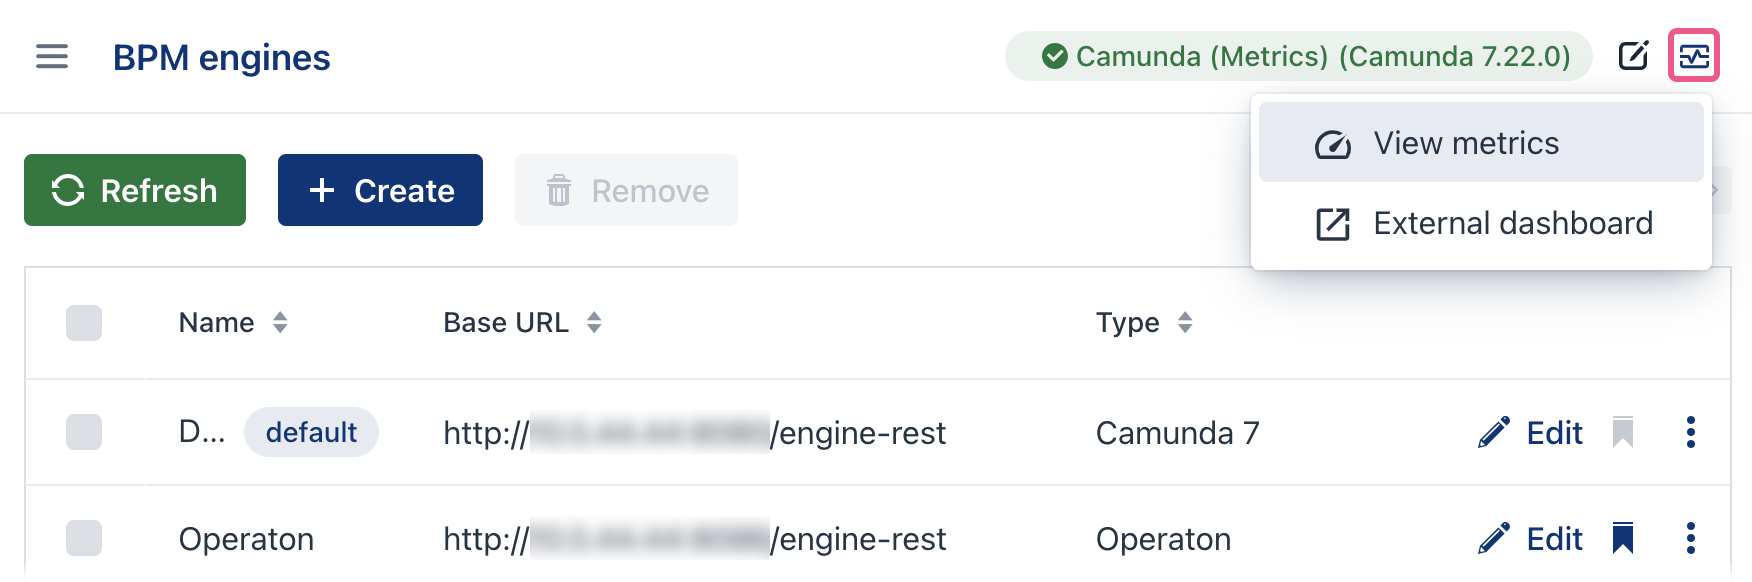
-
Navigate to the BPM Engines list in Flowset Control.
-
Click View metrics for the desired engine.
-
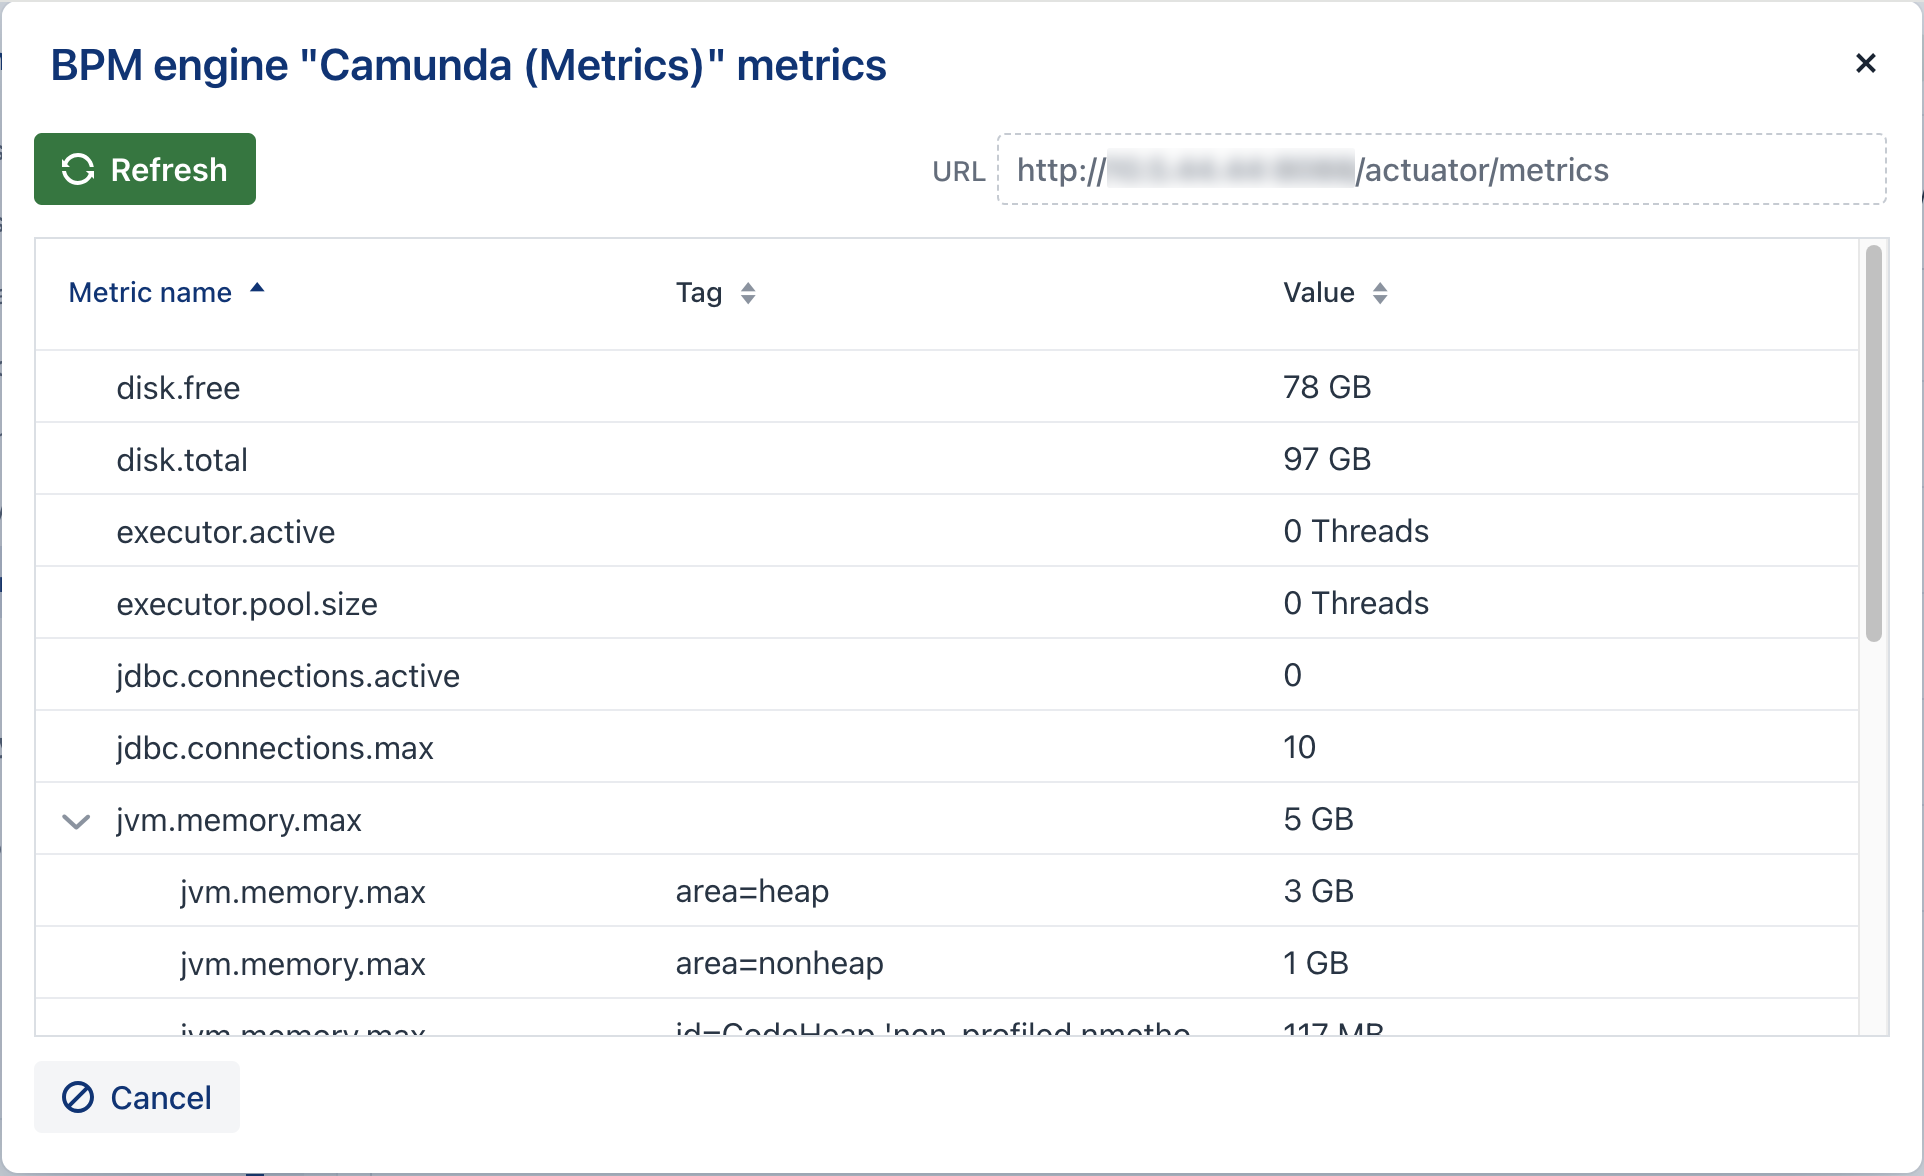
A dialog window will open:
-
All configured metrics and their tags.
-
Current metric values.
-
A Refresh button to update the values in real time.
-
|
Use the External dashboard button for quick access to the configured Grafana (or other) dashboard. 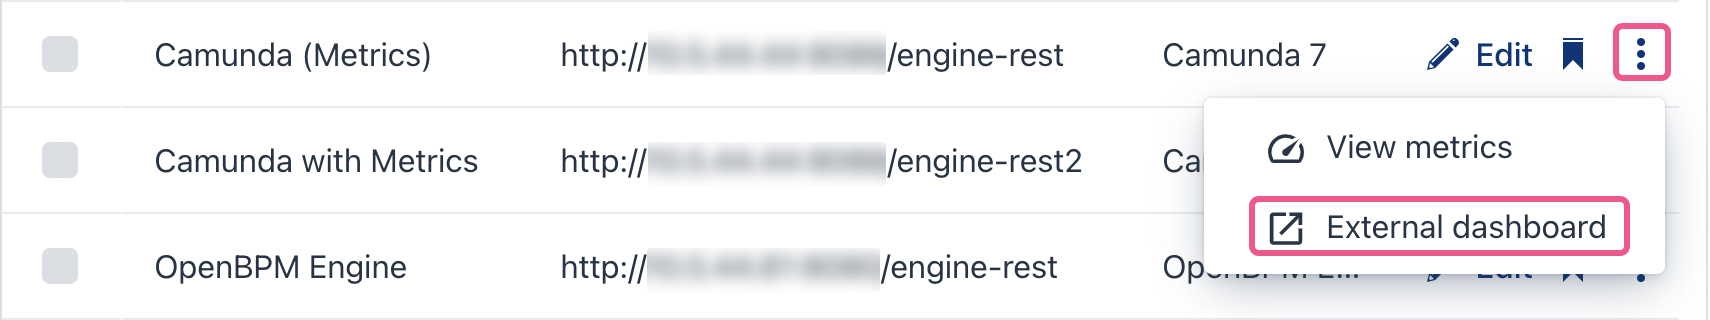
|