Dashboard
When you log in to Flowset Control, the first view you’ll see is the Dashboard. This is your main view for monitoring everything in the system. It shows important information through easy-to-read widgets that update in real time.

You can return to the Dashboard at any by clicking Flowset Control in the top-left corner or by selecting the Dashboard menu item.
Widgets:
-
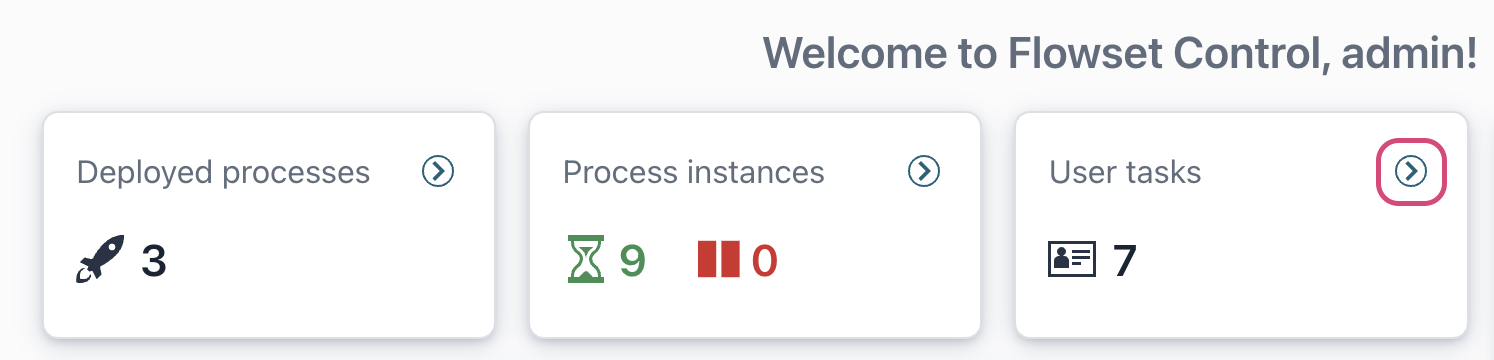
Deployed processes
This widget displays total count of active business processes.
-
Process instances
This widget shows the count of running process instances, categorized as either active or suspended.
-
User tasks
Presents the total number of user tasks that are currently active and awaiting completion.
-
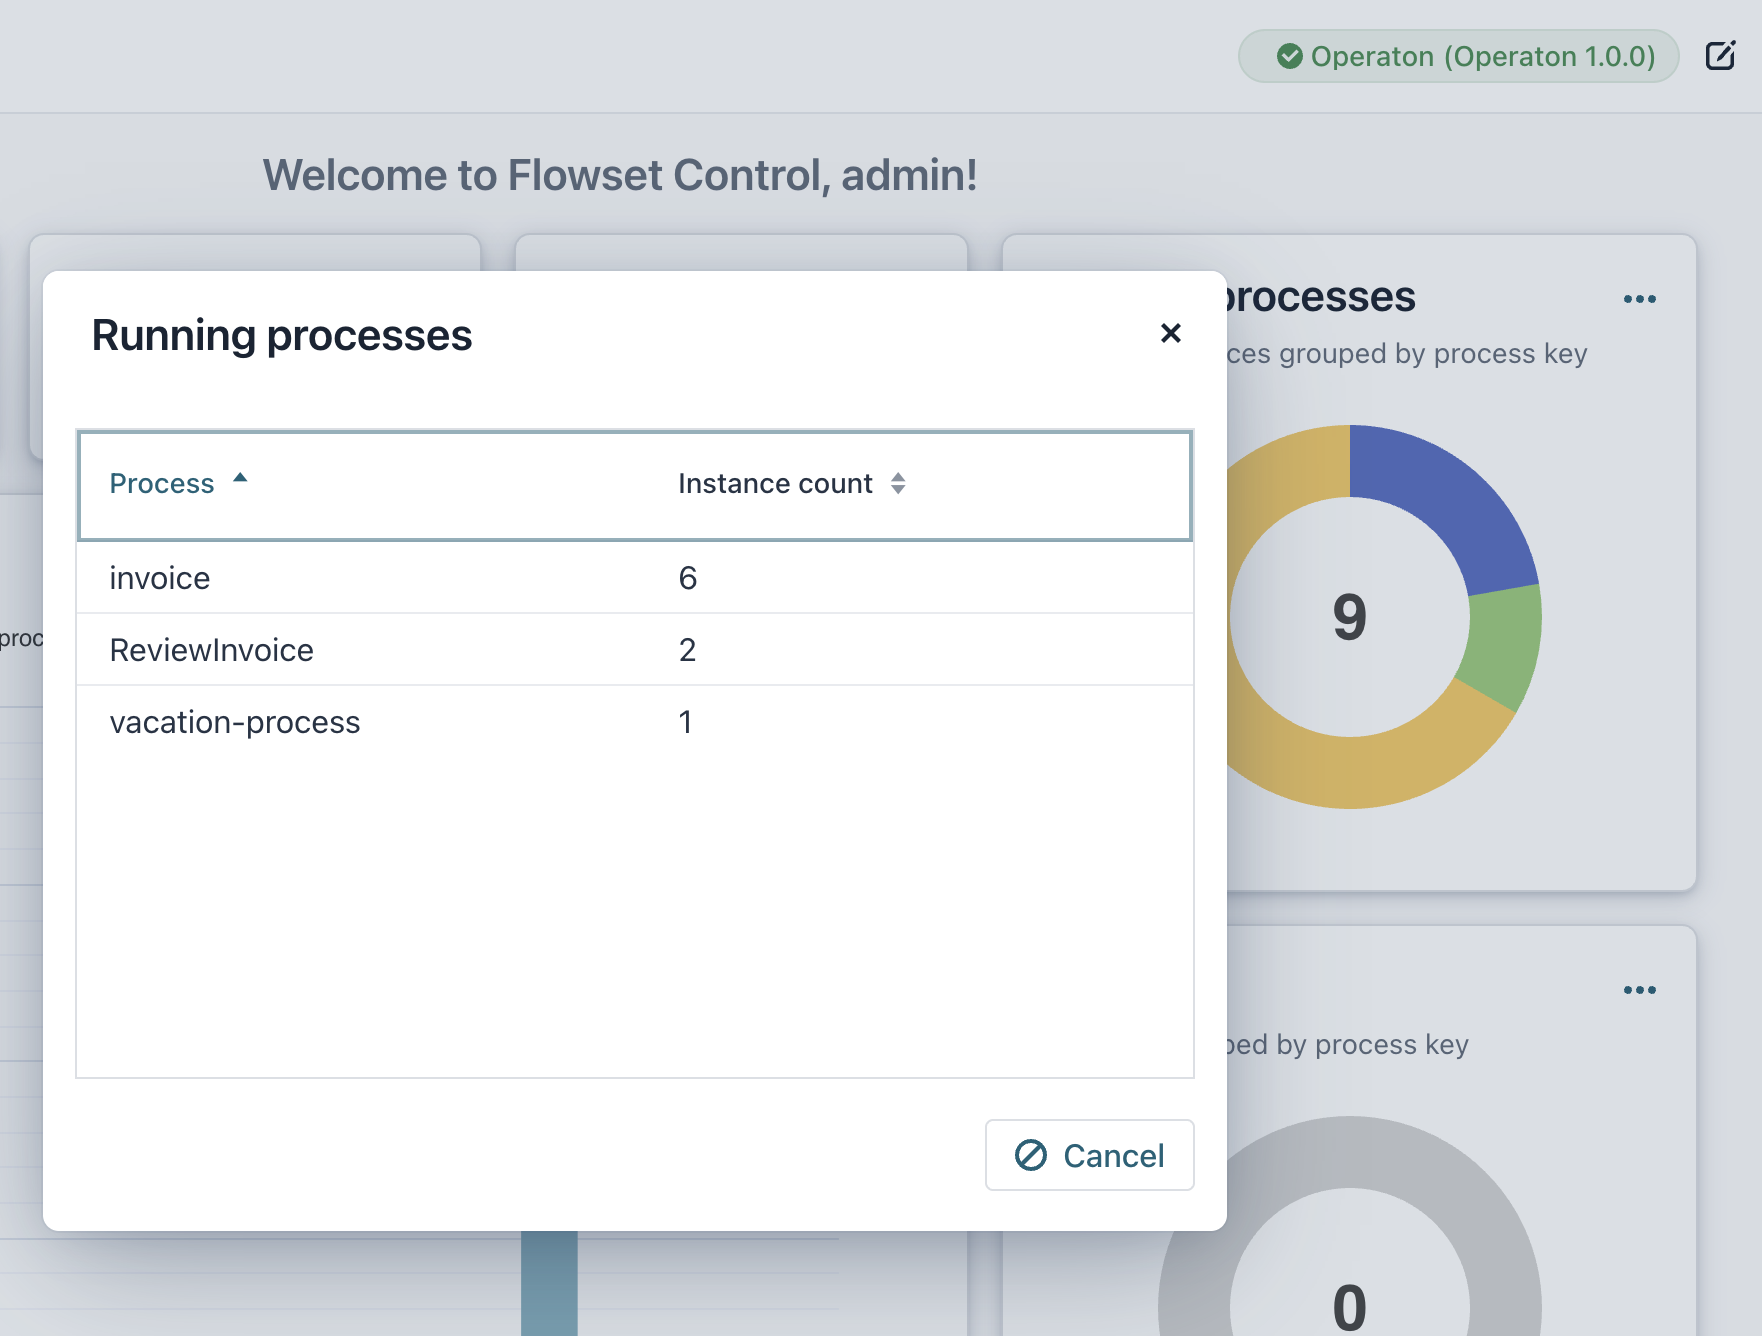
Running processes
This widget provides a pie chart of all currently running process instances, organized by their process definition key.
-
Incidents
The Incidents widget highlights the number of processes where errors or exceptions have occurred during execution.
-
Recent activity
A dynamic chart showcases recent activity, specifically tracking the number of processes launched and completed over the past week.
|