Heatmap
|
This feature is available exclusively in the Flowset Control Enterprise edition. |
Heatmaps, a Flowset Control Enterprise feature, provide a visual representation of the most frequently used execution paths in business processes. This makes it easy to identify bottlenecks and problem areas, helping to optimize processes.
To use this feature, navigate to the Heatmap menu.
Heatmaps are available for all versions of your processes. Use the drop-down list to select the process you want to analyze.
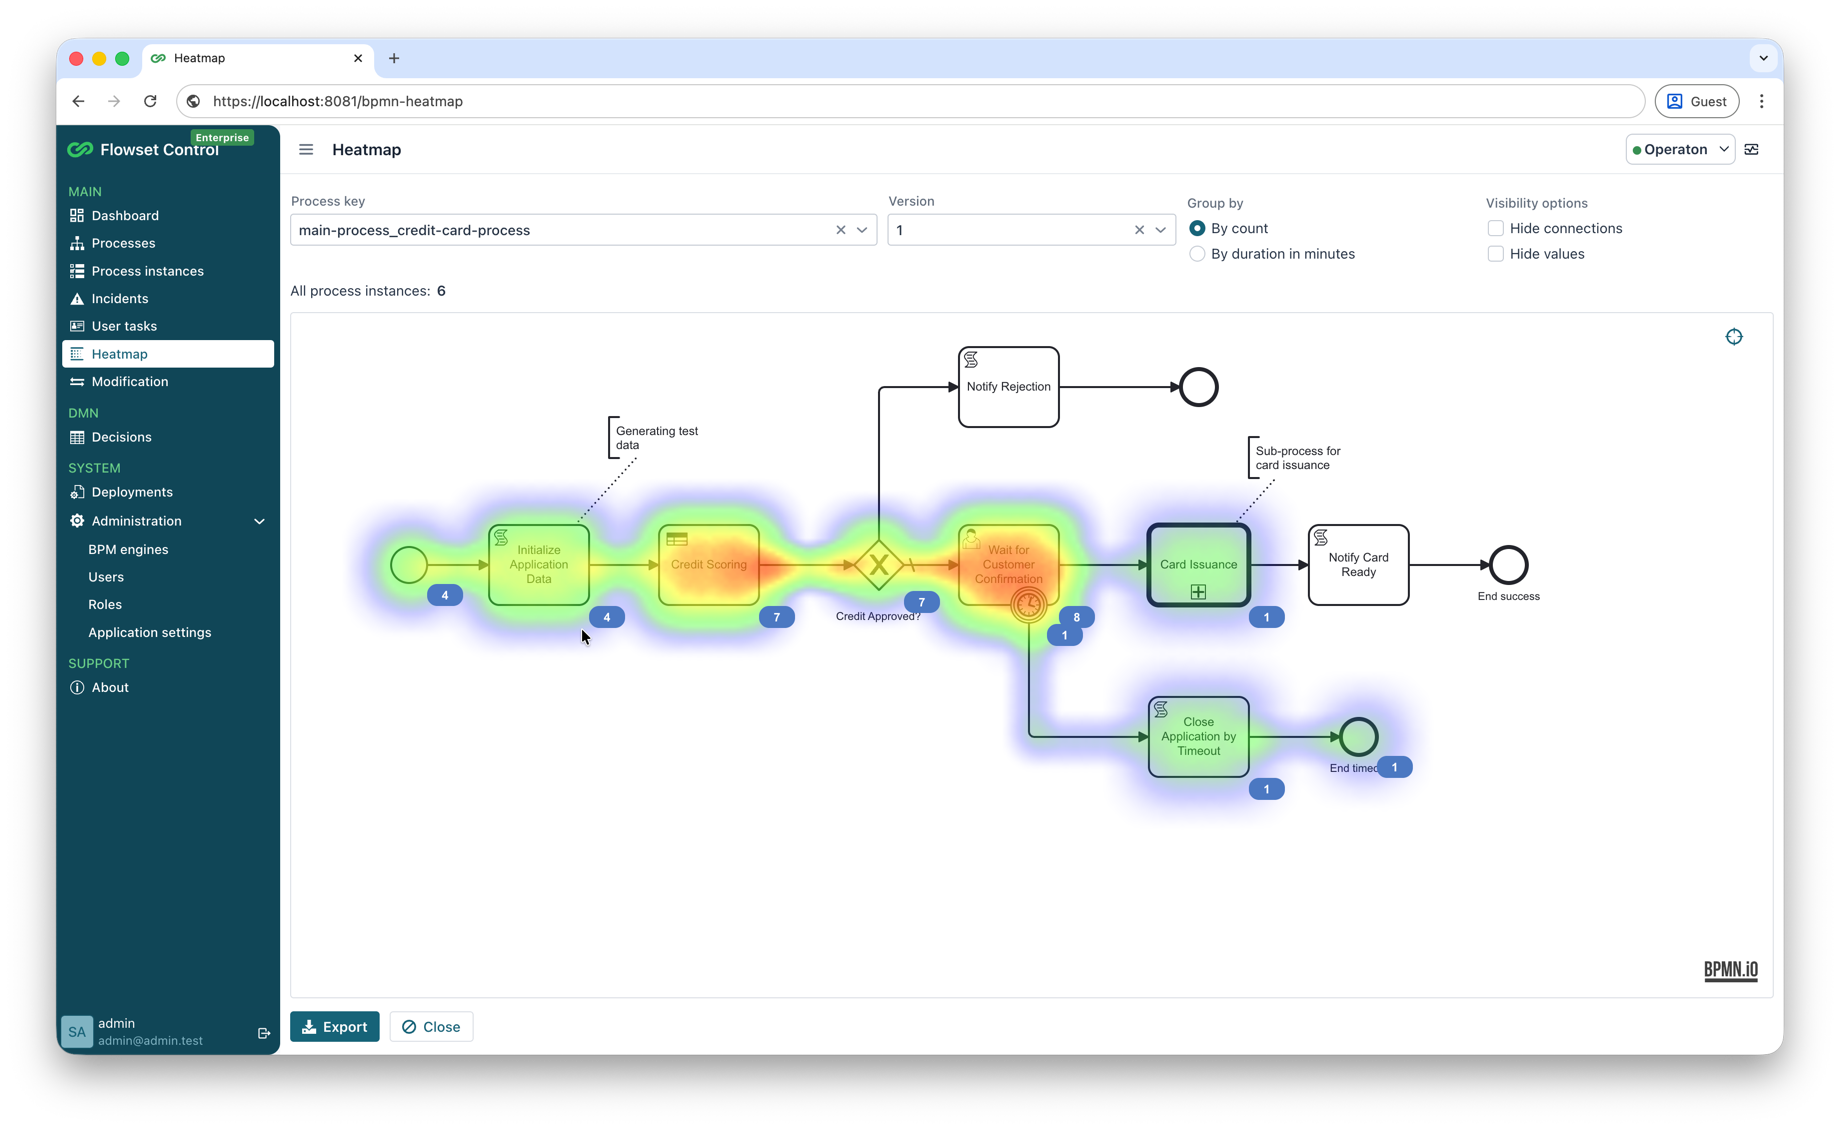
Heatmaps support two grouping modes for visualizing process data:
-
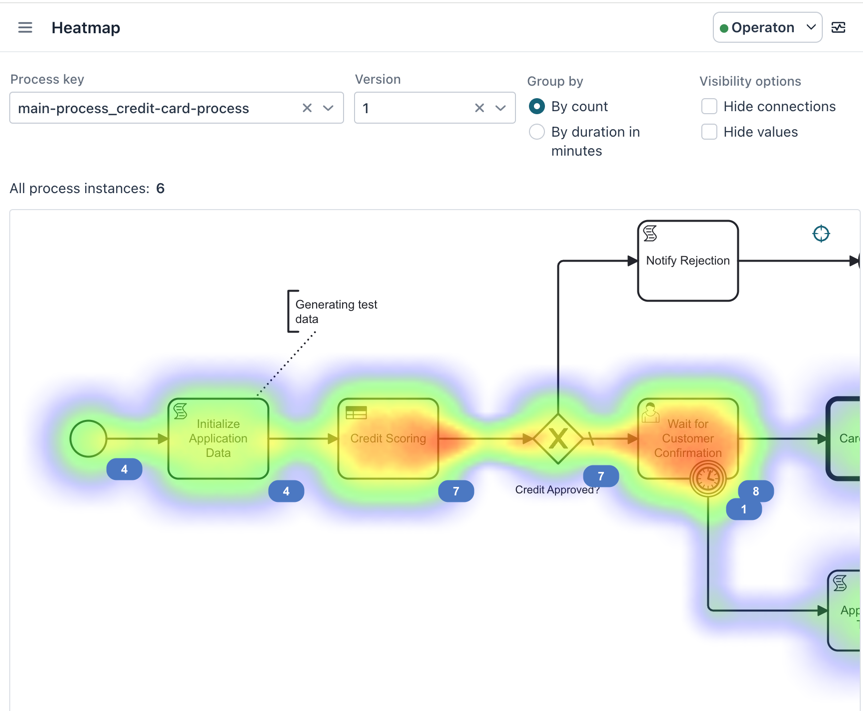
By Count
-
Displays how frequently tokens pass through each activity (task) in the process.
-
The numeric value shown on the heatmap next to an activity indicates how many times a token reached that activity.
Example: a value of 7 on a task means it was executed 7 times for the selected process version.
-
-
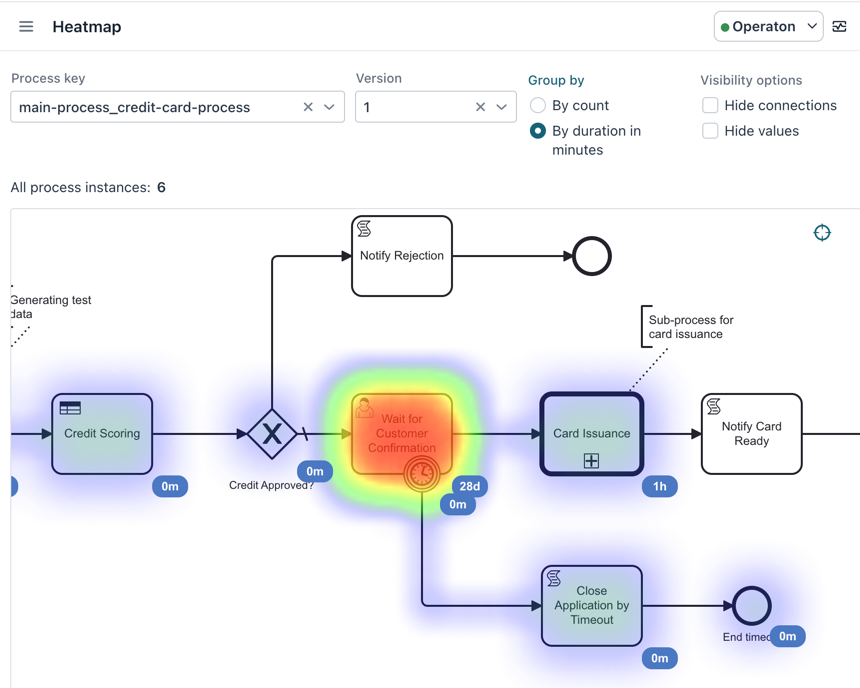
By Duration in Minutes
-
Displays the average time (in minutes) required to complete each activity.
-
The numeric value shows the average execution time for that activity.
-
|
For both grouping modes, you can use the Hide Connections checkbox to remove the connector arrows (sequence flows) between elements and focus solely on activities and their metrics. |